titler
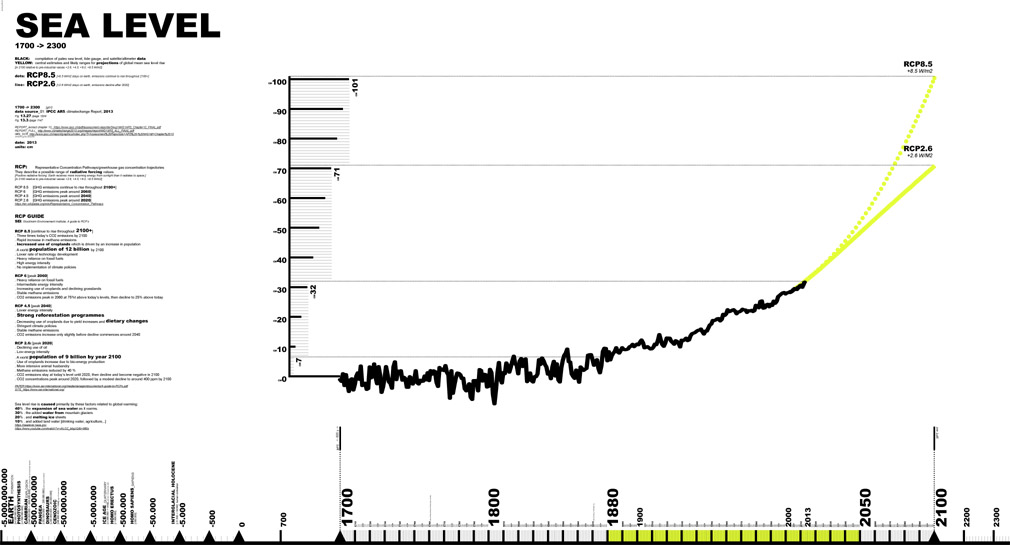
SEA LEVEL

subtitle
earth
date
2017 09 [source 2013]
caption
1700 -> 2100
BLACK:
Compilation of paleo sea level, tide gauge, and satelite/altimeter
data
YELLOW: central estimates and likely ranges for projections of global mean sea level rise
dots: RCP8.5 [+8.5 W/m2 stays on earth, emissions continue to rise throughout 2100+
line: RCP2.6 [+2.6 W/m2 stays on earth, emissions decline after 2020
[in 2100 relative to pre-industrial values +2.6, +4.5, +6.0, +8.5 W/m2]
date: 2013
data source
1700 -> 2100
[g01]
_
IPCC AR5 Fifth Assessment Report_climate change 2013: the physical science basis
Fig. 13.27./page 1204
Fig. 13.3./page 1147
GRAPH [g01] vectorfile
https://www.ipcc.ch/pdf/assessment-report/ar5/wg1/WG1AR5_Chapter13_FINAL.pdf
IPCC AR5 Fifth Assessment Report_climate change 2013: the physical science basis
Fig. 13.27./page 1204
Fig. 13.3./page 1147
GRAPH [g01] vectorfile
https://www.ipcc.ch/pdf/assessment-report/ar5/wg1/WG1AR5_Chapter13_FINAL.pdf
 < 1.1
< 1.2
< 1.1
< 1.2