appendix
ENERGY flow G_ 1 – 5
5
DATA SOURCE
5_1
unit: PJ, is in petajoules. 1 petajoule = 1 quadrillion joules.
All quantities are rounded to 2 significant digits and annual flows of less than 0.05 PJ are not included. Totals may not equal sum of flows due to statistical differences. Domestic supply includes changes in stocks. Further detail on how all flows are calculated can be found at http://flowcharts.llnl.gov. LLNL-MI-410527. Source: LLNL 2014.
All quantities are rounded to 2 significant digits and annual flows of less than 0.05 PJ are not included. Totals may not equal sum of flows due to statistical differences. Domestic supply includes changes in stocks. Further detail on how all flows are calculated can be found at http://flowcharts.llnl.gov. LLNL-MI-410527. Source: LLNL 2014.
534.000 PJ production
210.000 PJ consumtion [42%]
290.000 PJ rejected energy [58%]
Transportation rejected energy [80%]
210.000 PJ consumtion [42%]
290.000 PJ rejected energy [58%]
Transportation rejected energy [80%]

5_2
data source:
IEA [International Energy Agency], 2015, Energy Balance flow
[Balance, Total Final Connsumption]
IEA [International Energy Agency], 2015, Energy Balance flow
[Balance, Total Final Connsumption]
ENERGY PRODUCTION:
Fig. WORLD Balance [produnction/ consumption]
by sector [BAL]_2015
799592 PJ_production
392871 PJ_consumption
406750 PJ_rejected endergy = 49%
Fig. WORLD Balance [produnction/ consumption]
by sector [BAL]_2015
799592 PJ_production
392871 PJ_consumption
406750 PJ_rejected endergy = 49%
ENERGY CONSUMPTION:
Fig. WORLD Total final consumption
by sector [TFC]_2015
392871 PJ
Fig. WORLD Total final consumption
by sector [TFC]_2015
392871 PJ
4
WHAT IS
4_1 energy EFFICIENCY
is the ratio between the useful output of an energy conversion machine and the input, in energy terms.
The input, as well as the useful output may be chemical, electric power, mechanical work, light (radiation), or heat.
The input, as well as the useful output may be chemical, electric power, mechanical work, light (radiation), or heat.
EFFICIENCIES – energy conversion
Water turbine_90%
Car - electric - Li ionen _ 65 - 80%
Wind turbine_59%
Gas turbine_40%
Car - diesel _ 25 - 30%
Car - gasoline_ 21 - 24%
Solar cell_20%
Photosynthesis_6%
Water turbine_90%
Car - electric - Li ionen _ 65 - 80%
Wind turbine_59%
Gas turbine_40%
Car - diesel _ 25 - 30%
Car - gasoline_ 21 - 24%
Solar cell_20%
Photosynthesis_6%
4_1_1 energy EFFICIENCY
EFFICIENCIES – energy conversion
Electric motor (large, ca. 200w)_90%
Battery (Lithium-ion)_90%
Electric motor (small, ca. 100w)_65%
Steam turbine (electrical generator)_45%
Gas turbine (aircraft)_35%
Automobile engine_25%
Steam locomotive_10%
Electric motor (large, ca. 200w)_90%
Battery (Lithium-ion)_90%
Electric motor (small, ca. 100w)_65%
Steam turbine (electrical generator)_45%
Gas turbine (aircraft)_35%
Automobile engine_25%
Steam locomotive_10%
SITE_http://web.ceu.hu/crc/Syllabi/west-syllabi/documents/Envsci/env5.html
SITE_https://www.ems.psu.edu/~radovic/matsc101.html
SITE_https://www.ems.psu.edu/~radovic/matsc101.html

3
AGREEMENT
3_1
PARIS climate agreement
is an agreement within the United Nations Framework Convention on Climate Change (UNFCCC) dealing with greenhouse gas emissions mitigation [Reduzierung]
, adaptation and finance starting in the year 2020.
signed 04 2016
end 2017 195 UNFCCC members have signed the agreement [164 ratified it].
The contributions of the individual countries are called: NDCs - nationally determined contributions.
[CO2 emissions 2015: China 29.4%, US 14.3%, EEA 9.8%, India 6.8%, Russia 4.9%, Japan 3.5%, other 31.5%]
ARTICLE 3 requires them to be ambitious. Each further ambition should be more ambitious than the previous one, known as the principle of progression.
The specific climate goals are politically encouraged, rather than legally bound.
3_1_1 AIMS
A. Holding the increase in the global average temperature to well below 2 °C above pre-industrial levels and to pursue efforts to limit the temperature increase to 1.5 °C above pre-industrial levels, recognizing that this would significantly reduce the risks and impacts of climate change;
B. Increasing the ability to adapt to the adverse [nachteilig] impacts of climate change and foster climate resilience [Belastbarkeit] and low greenhouse gas emissions development, in a manner that does not threaten food production;
C. Making finance flows consistent with a pathway towards low greenhouse gas emissions and climate-resilient development.“ Countries furthermore aim to reach „global peaking of greenhouse gas emissions as soon as possible“.
3_1_2 START 2018 [-2025]
The global stocktake will kick off in 2018 with a facilitative dialogue, evaluation in 2025.
[parties will evaluate nearer-term goal and and the long-term goal of achieving net zero emissions after 2050+.]
The negotiators of the Agreement, however, stated that the NDCs and the 2 °C reduction target were insufficient;
instead, a 1.5 °C target is required, noting „with concern that the estimated aggregate greenhouse gas emission levels in 2025 and 2030 resulting from the intended nationally determined contributions do not fall within least-cost 2 °C scenarios but rather lead to a projected level of 55 gigatonnes in 2030“,
and recognizing furthermore „that much greater emission reduction efforts will be required in order to hold the increase in the global average temperature to below 2 °C by reducing emissions to 40 gigatonnes or to 1.5 °C“.
[in the first half of 2016 average temperatures were about 1.3 °C [although not the sustained temperatures over the long term which the Agreement addresses] .
2
RE_SOURCES
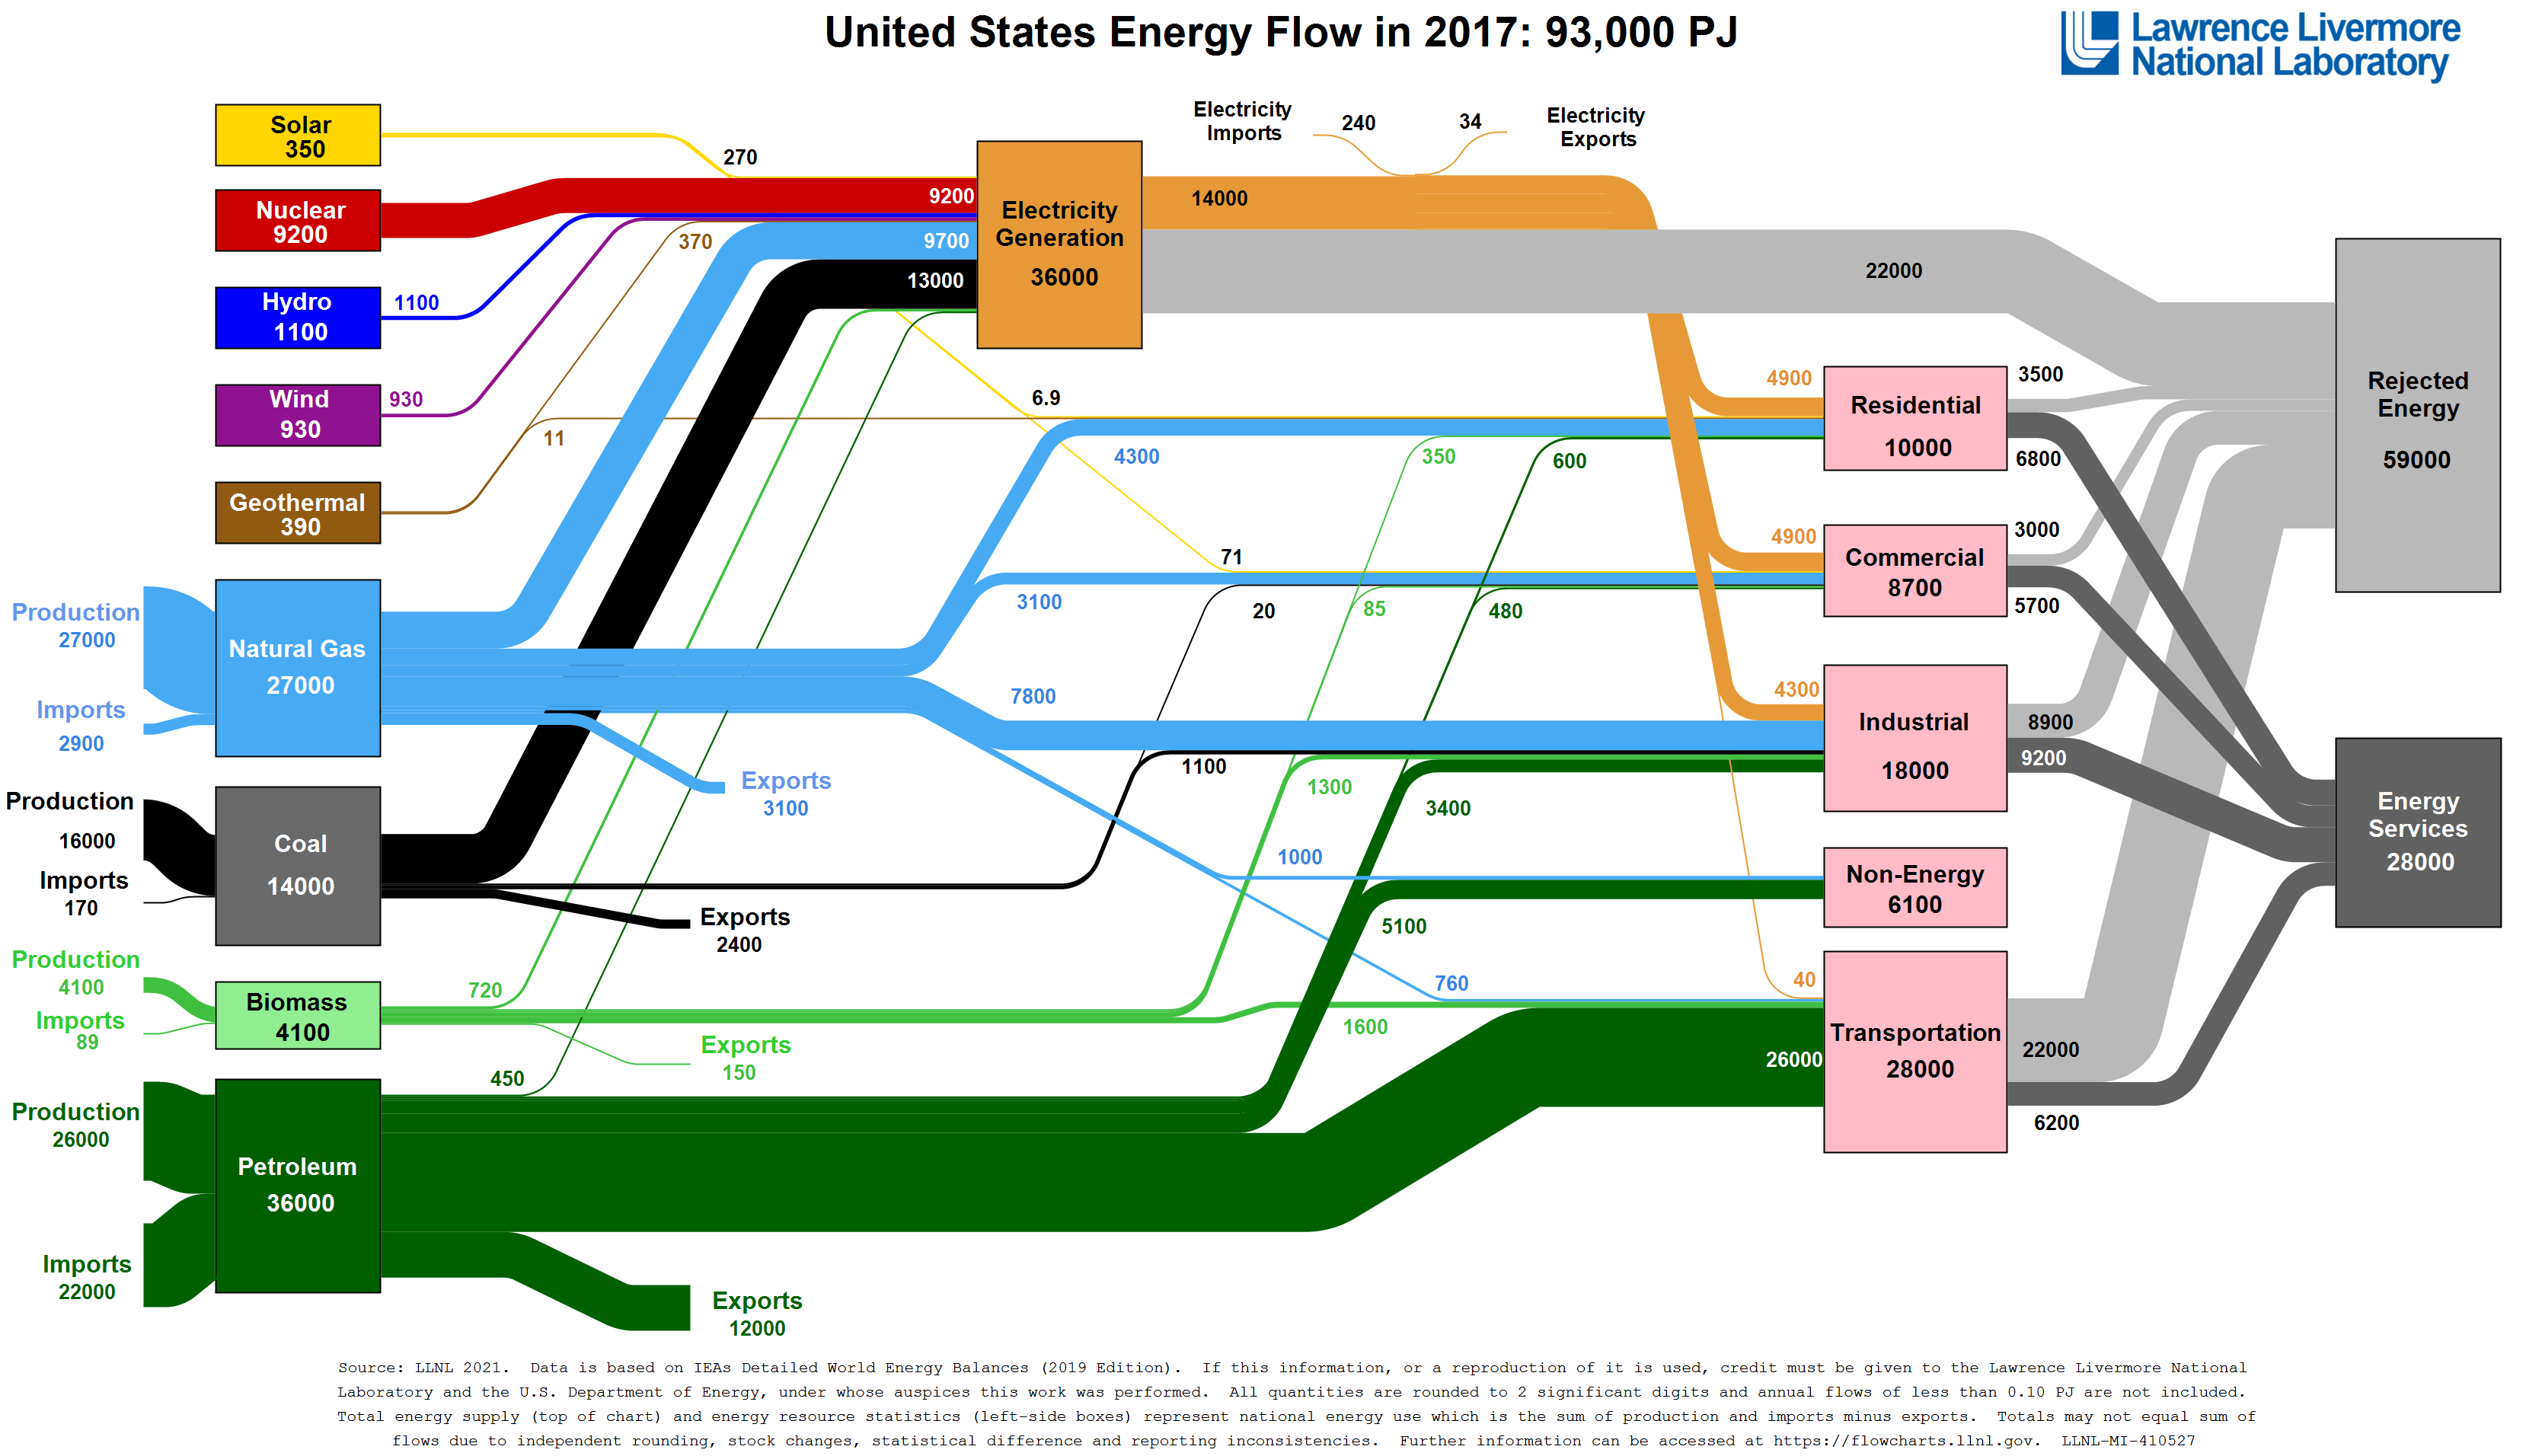
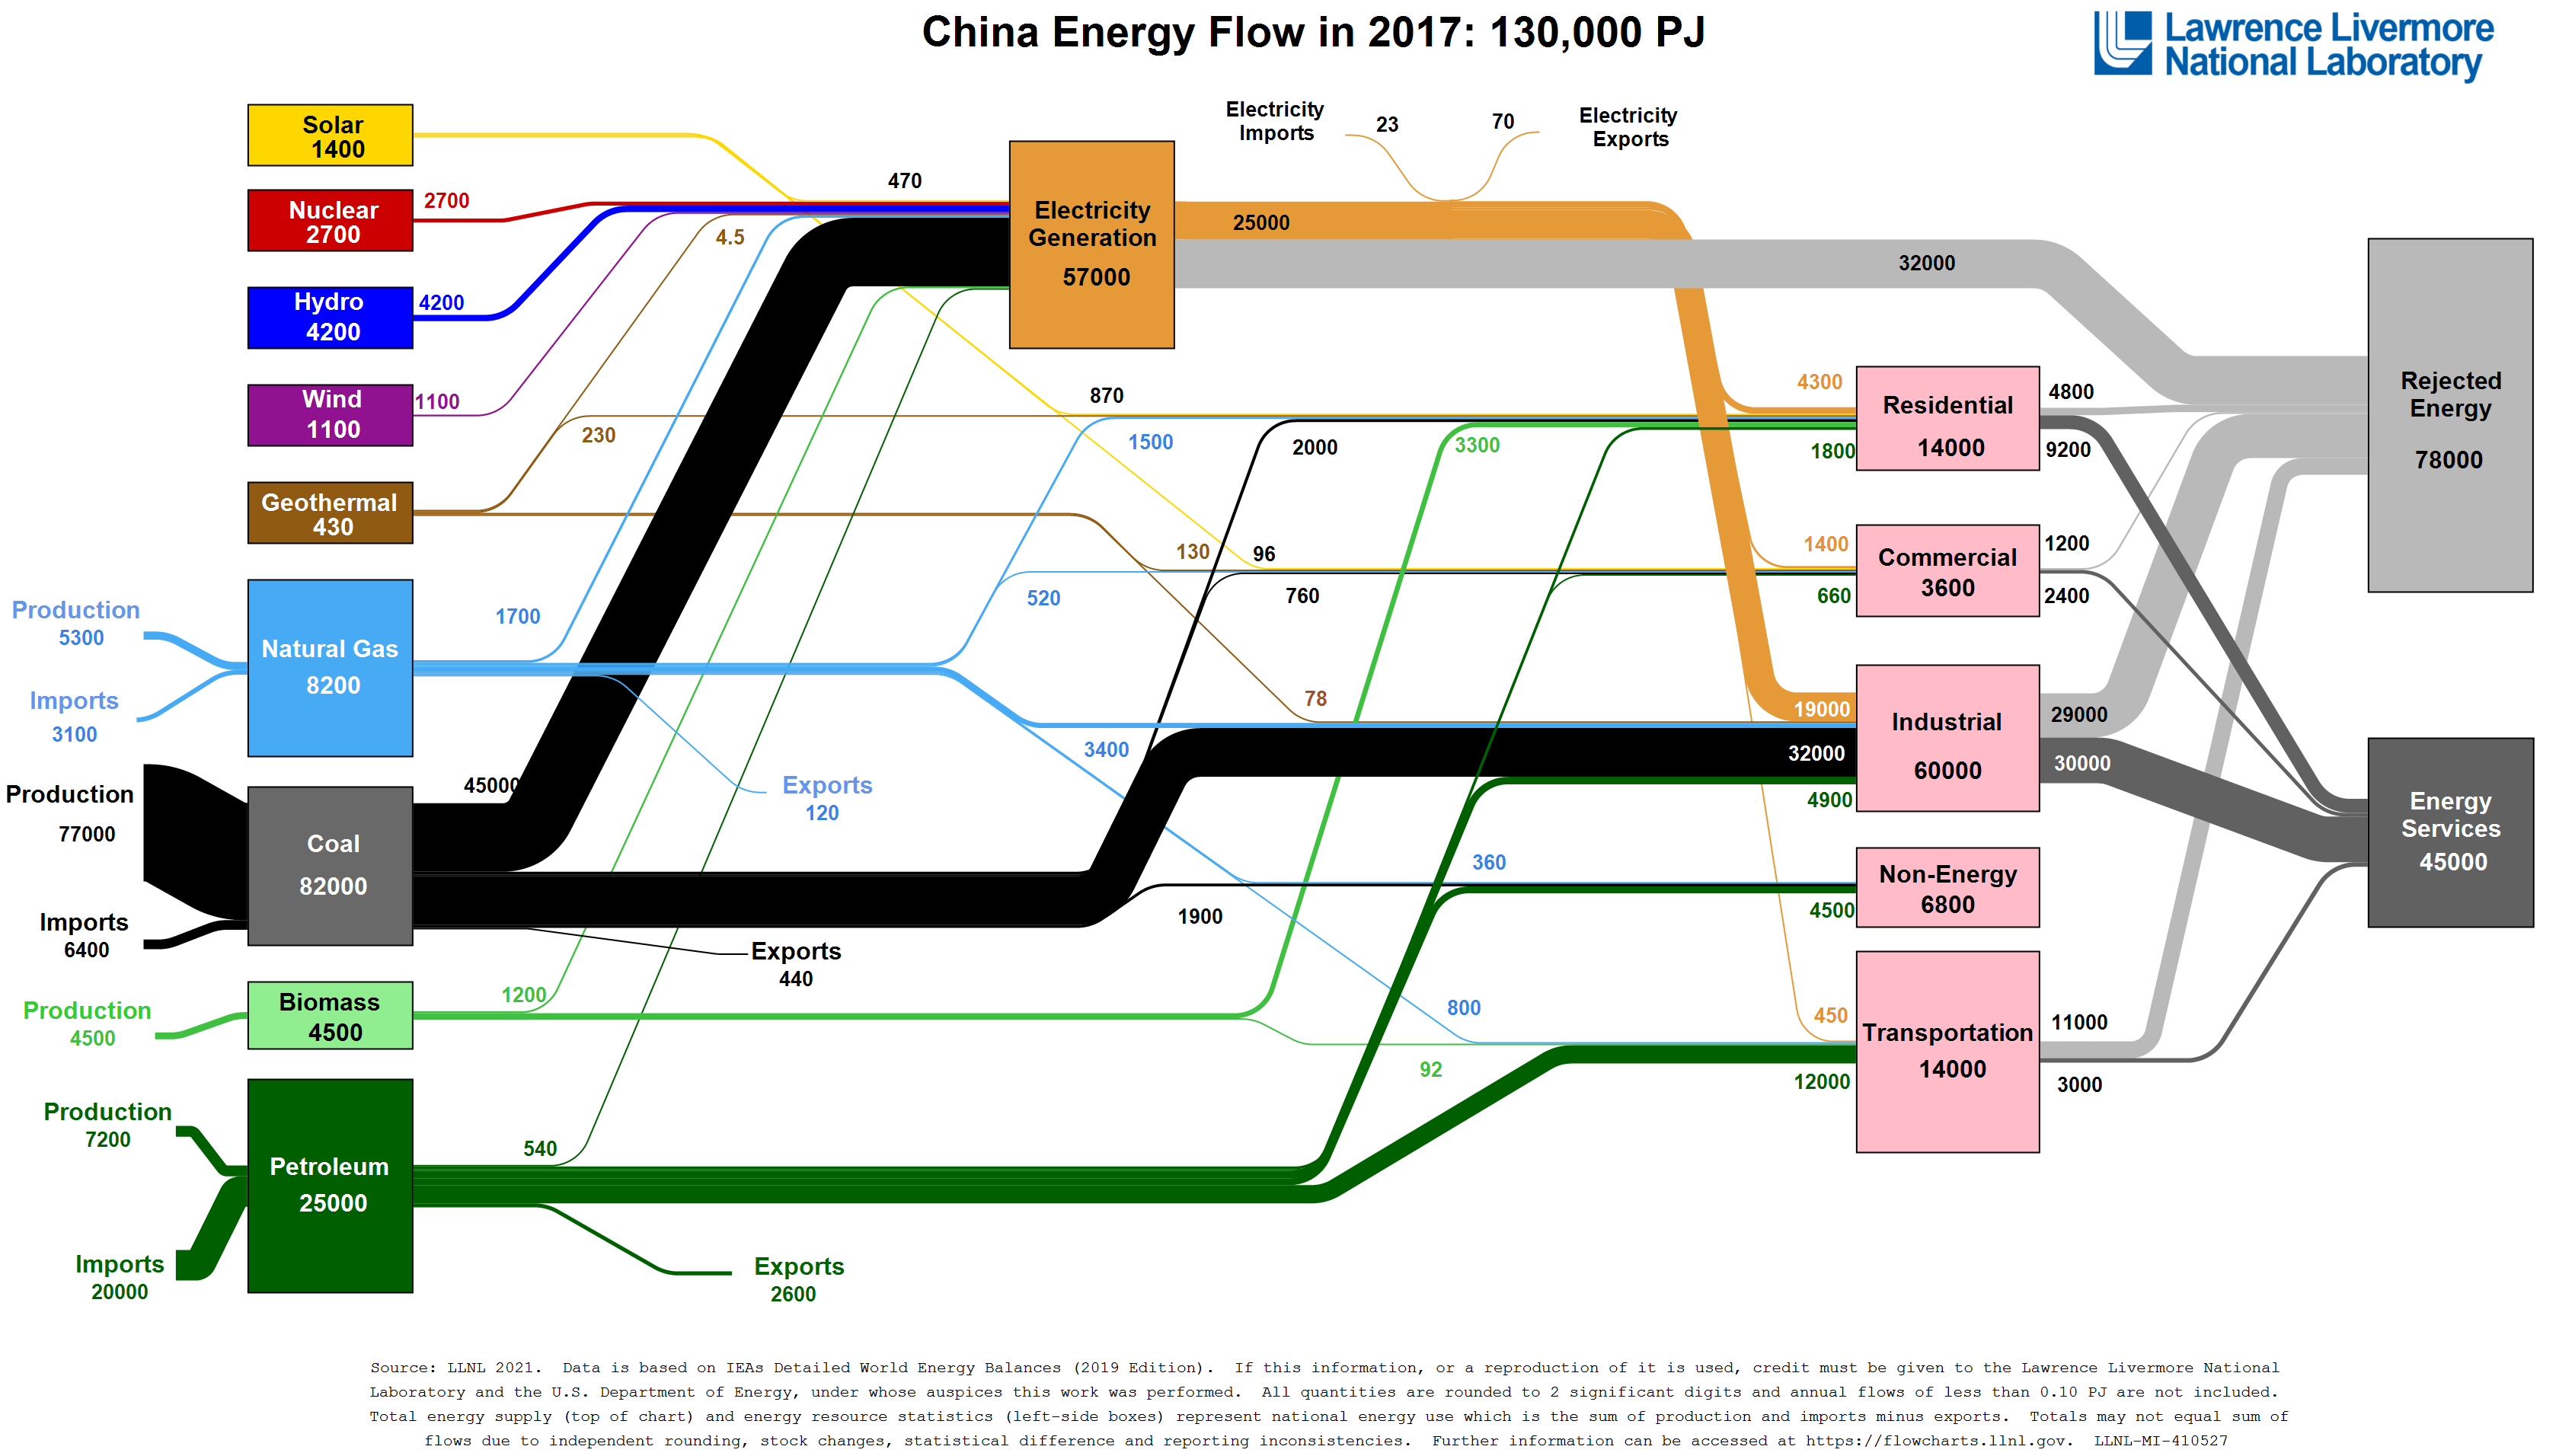
2_1 LLNL
The U.S. Lawrence Livermore National Laboratory,
is an American federal research facility in Livermore, California, United States, founded by the University of California, Berkeley in 1952.
is an American federal research facility in Livermore, California, United States, founded by the University of California, Berkeley in 1952.
2_1_0 LLNL_FLOWCHARTS
Energy consumption
Carbon
estimated International Energy Flows_2007
2_1_1
World_2011
534.000 PJ production
210.000 PJ consumtion [48%]
290.000 PJ rejected energy [52%]
Transportation rejected energy [75%]
210.000 PJ consumtion [48%]
290.000 PJ rejected energy [52%]
Transportation rejected energy [75%]
U.S._2017 [unit: QUADS]
China_2011/2017
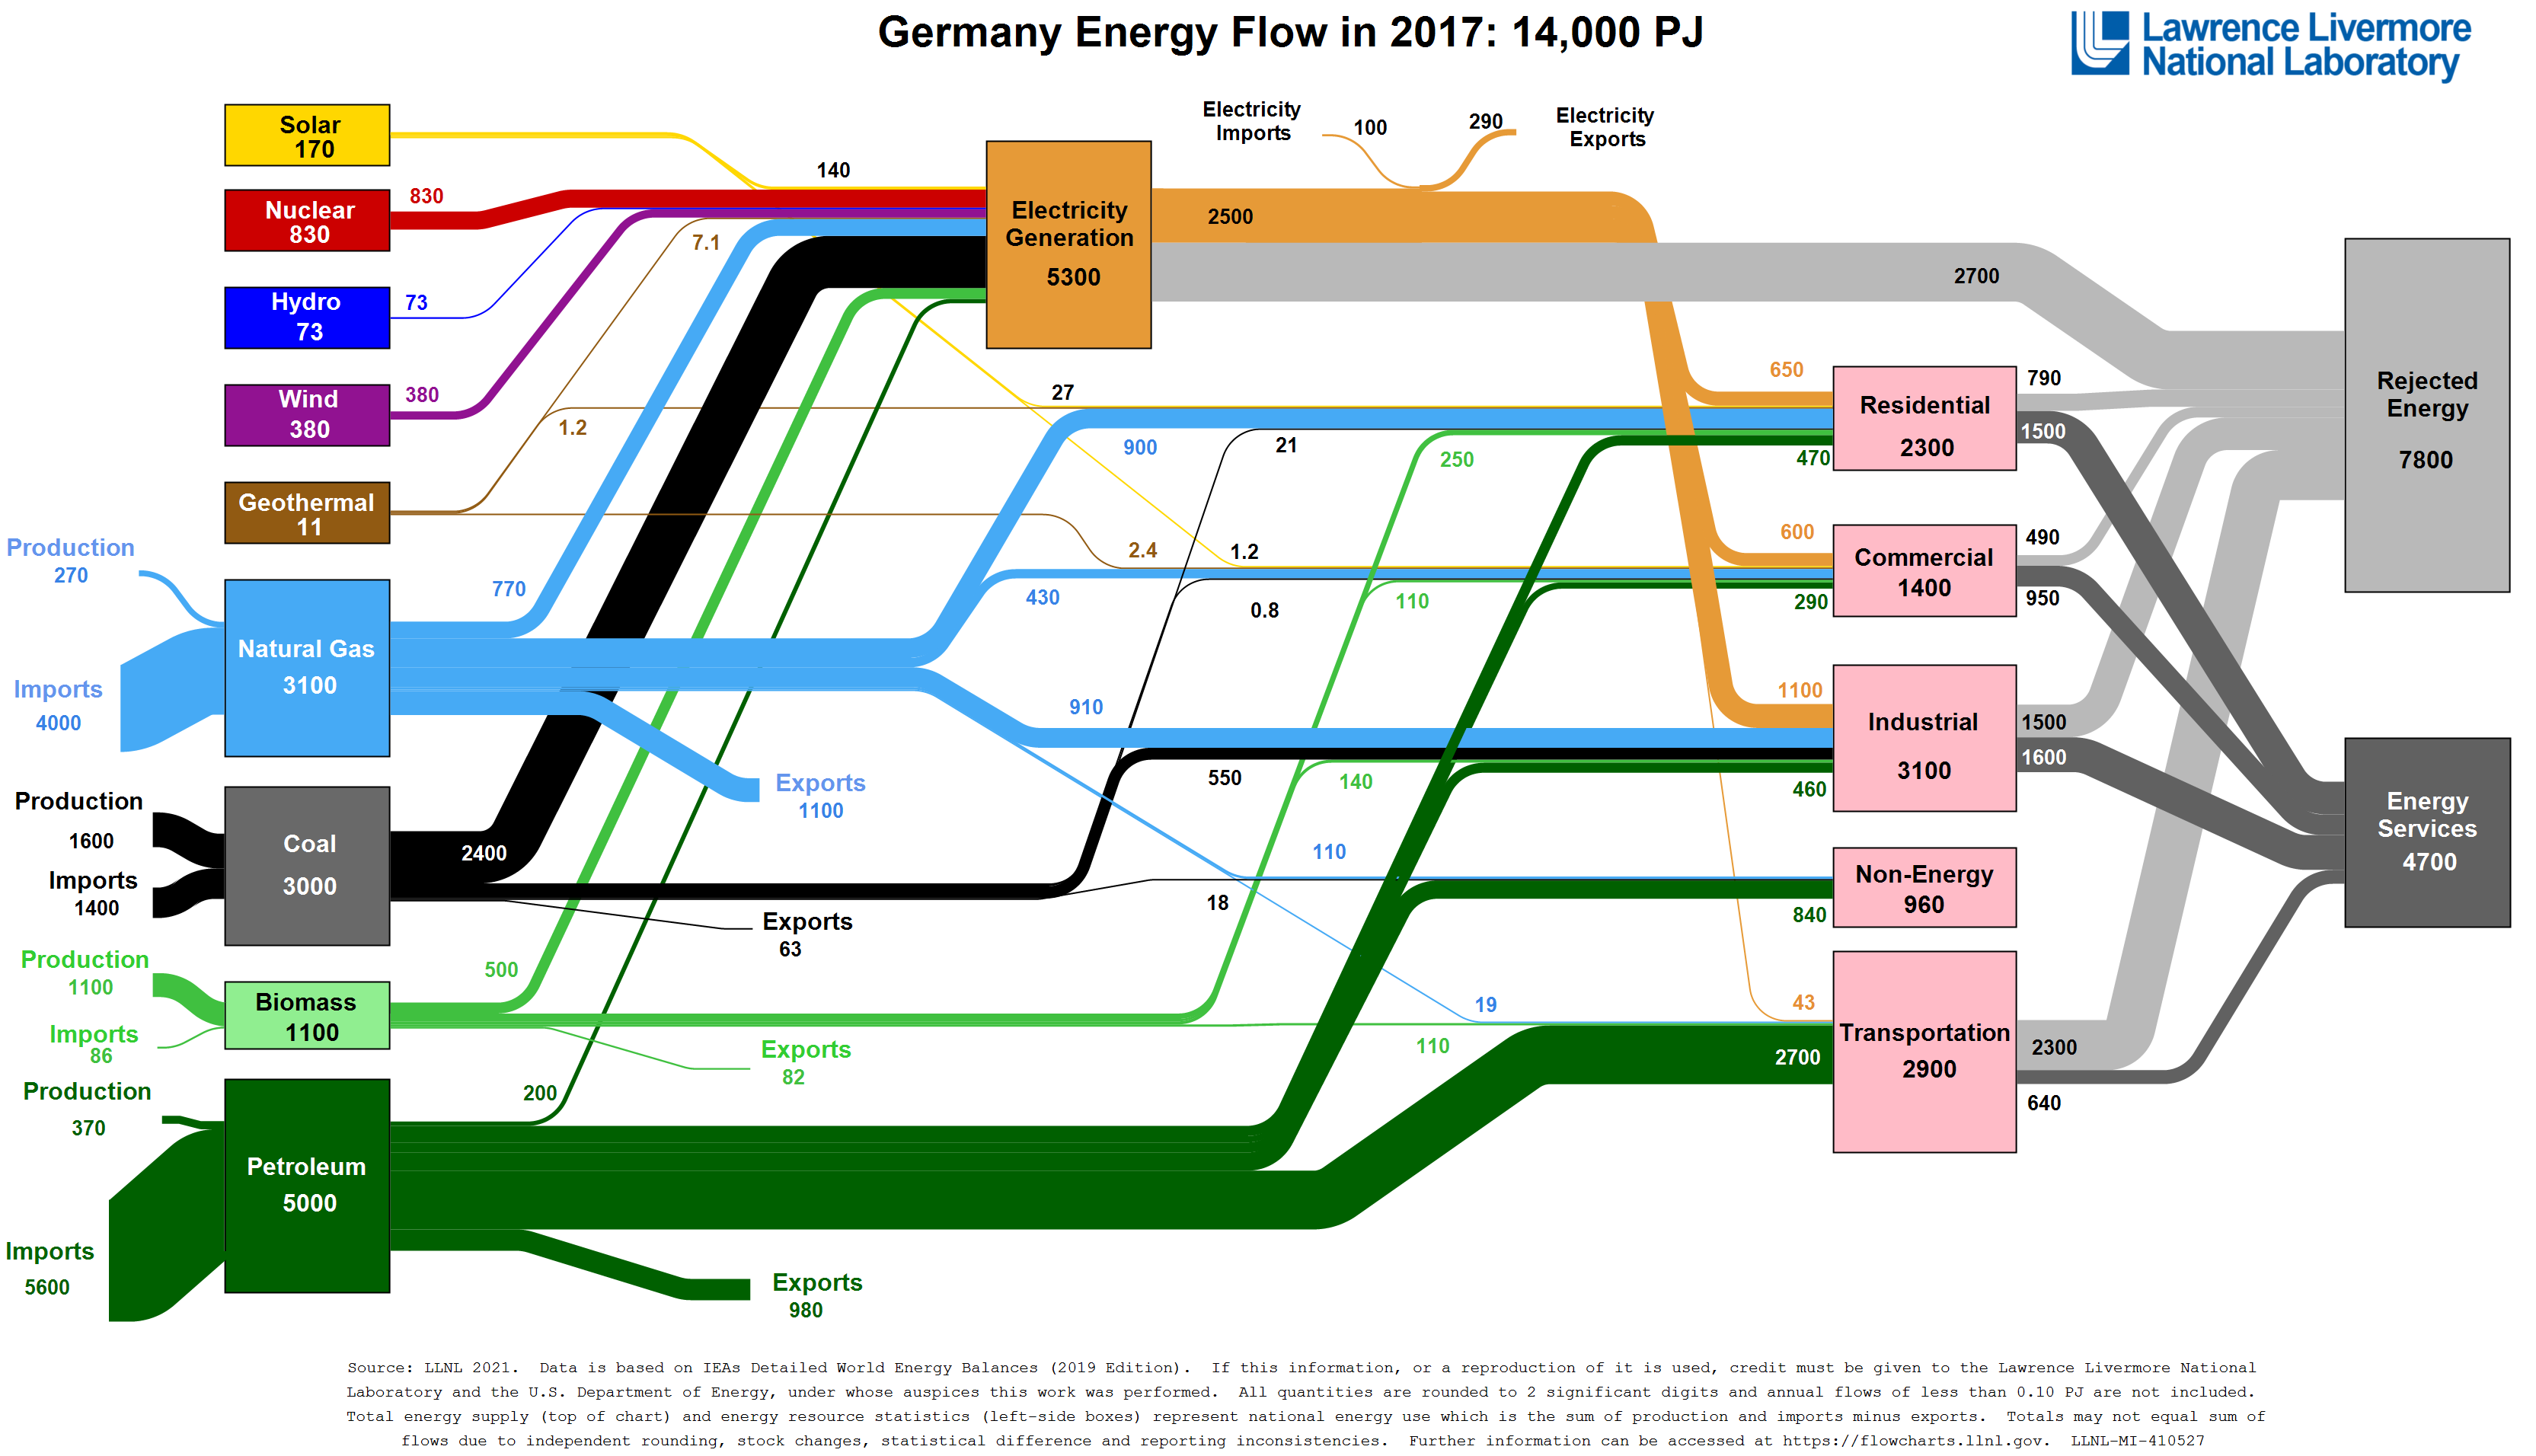
Germany_2011/2017
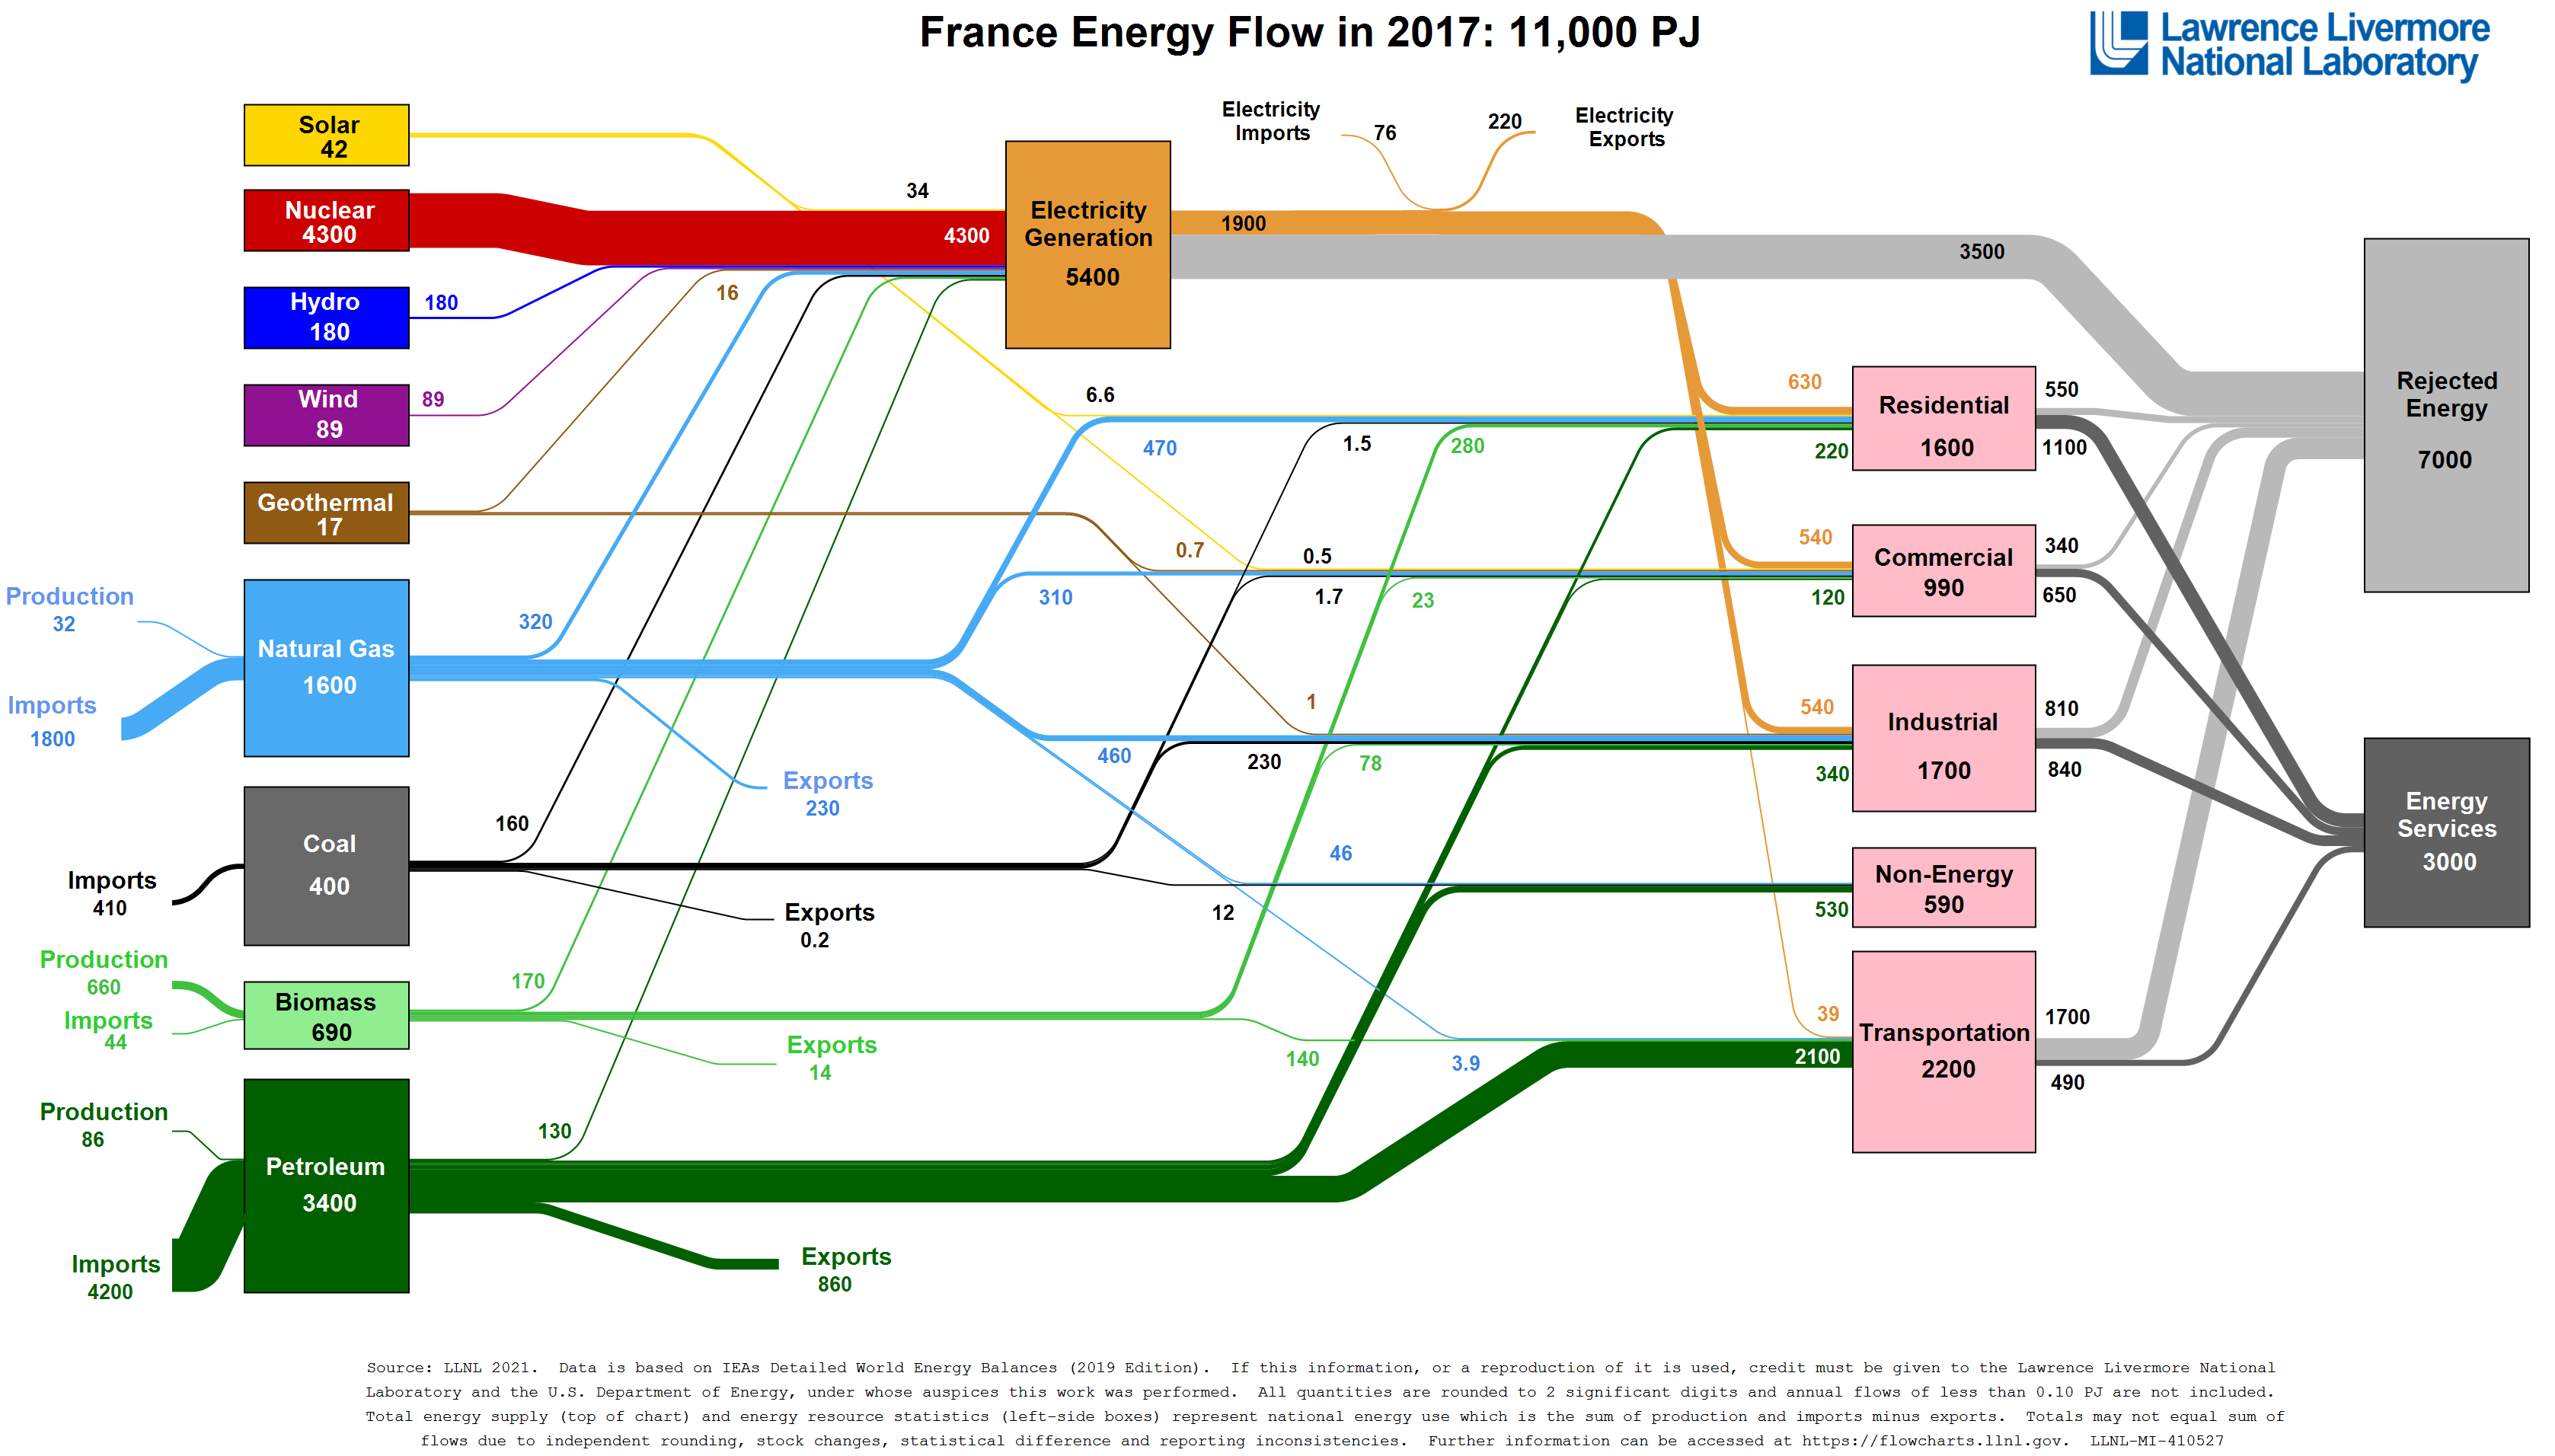
France_2011/2017
2_2 WRI
World Resources Institute
is a global research non-profit organization that was established in 1982 with funding from the John D. and Catherine T. MacArthur Foundation
is a global research non-profit organization that was established in 1982 with funding from the John D. and Catherine T. MacArthur Foundation
2_2_1
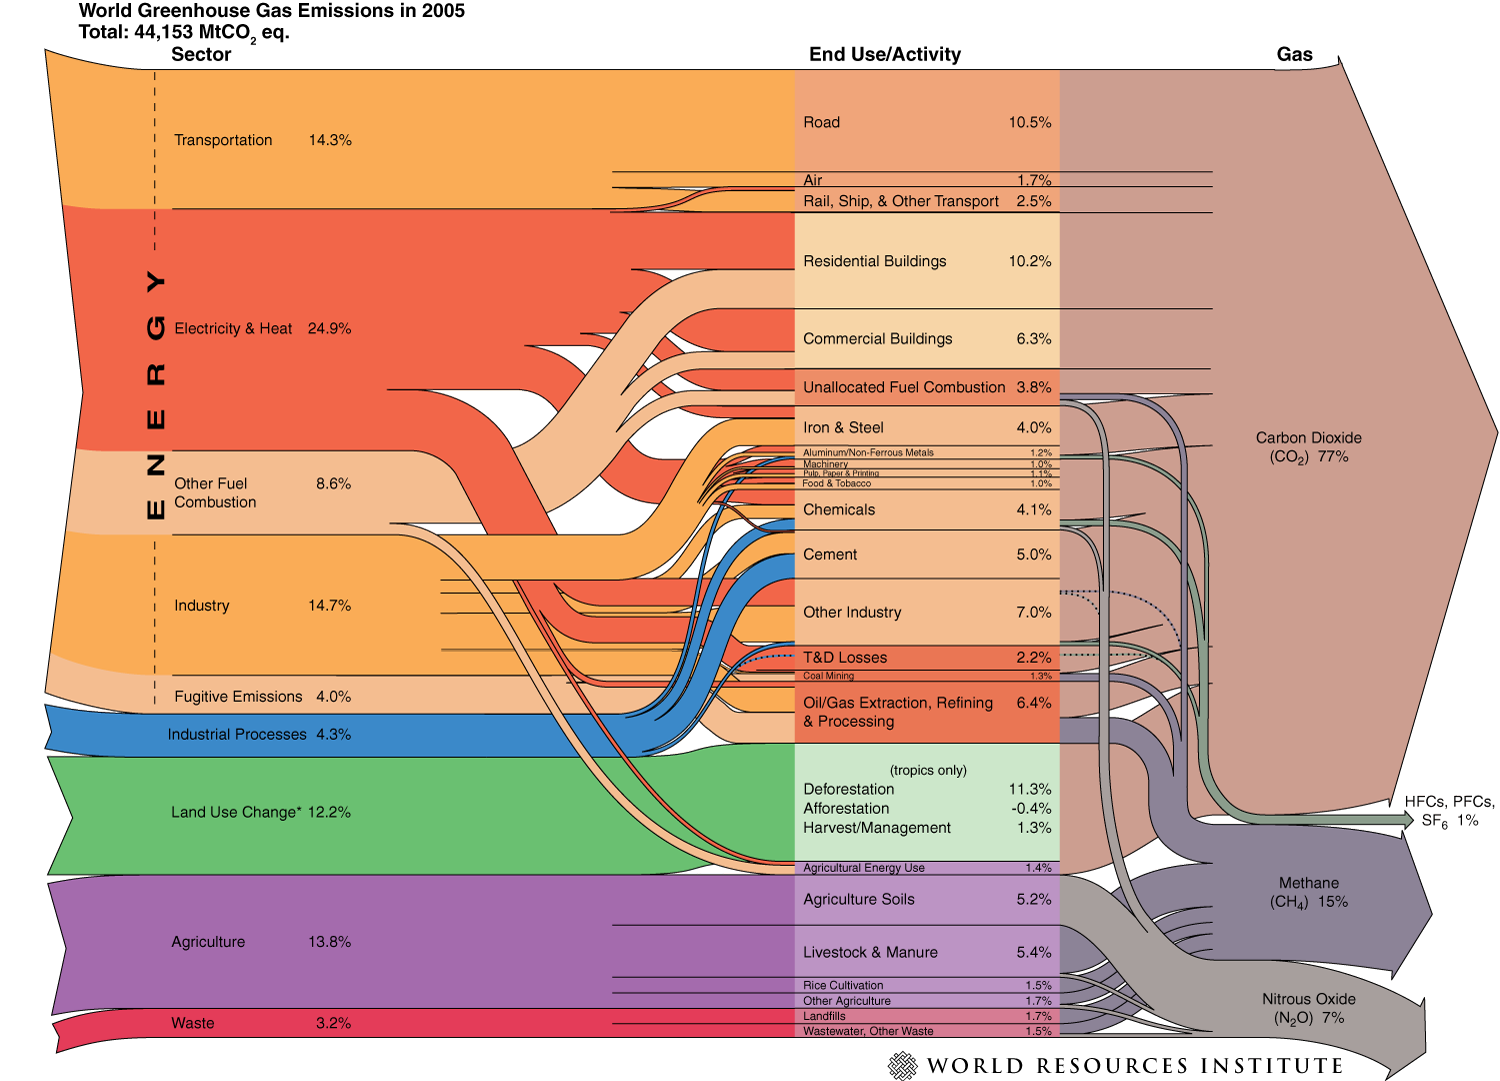
World Greenhouse Gas Emissions_2005
44,135 Mt CO2 eq. by sector
44,135 Mt CO2 eq. by sector
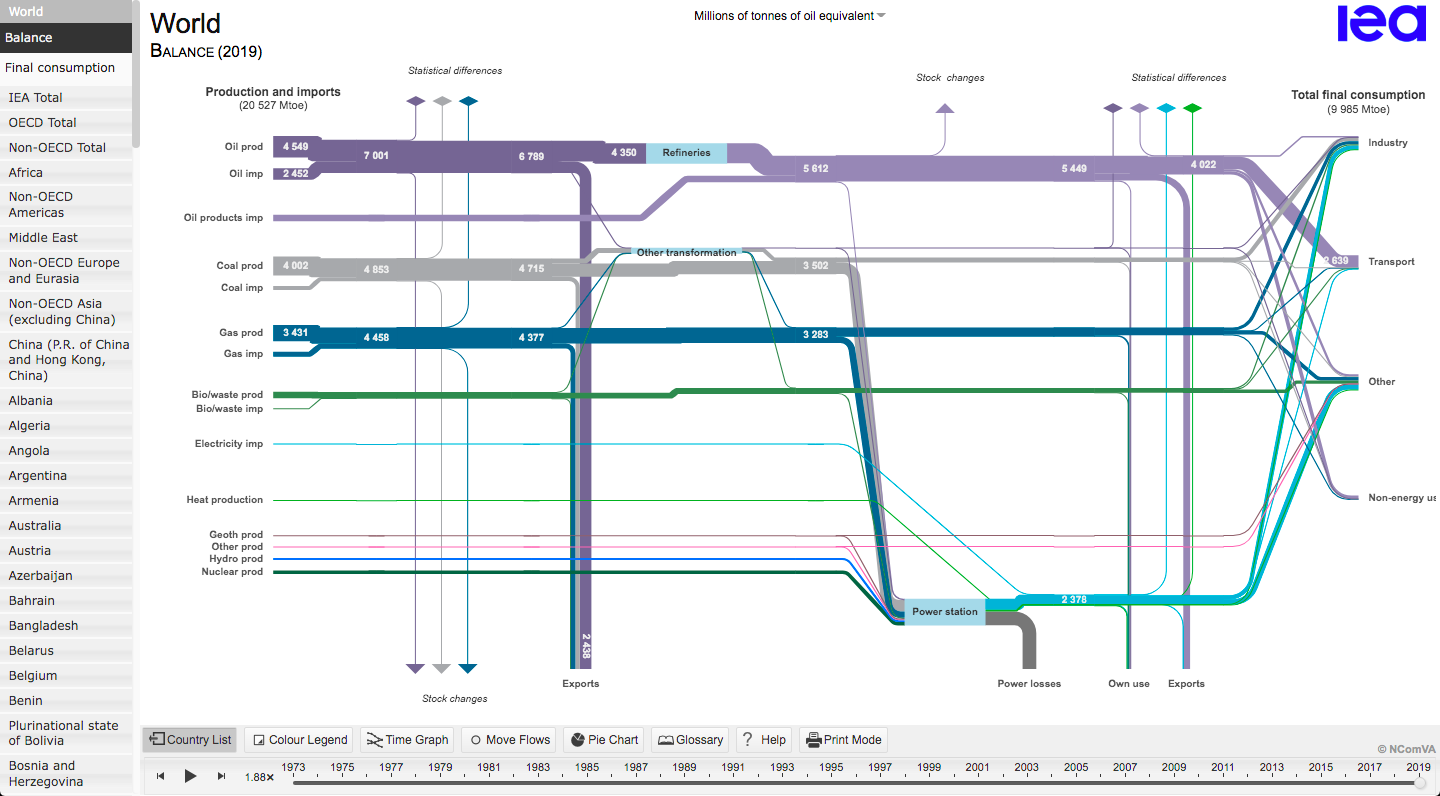
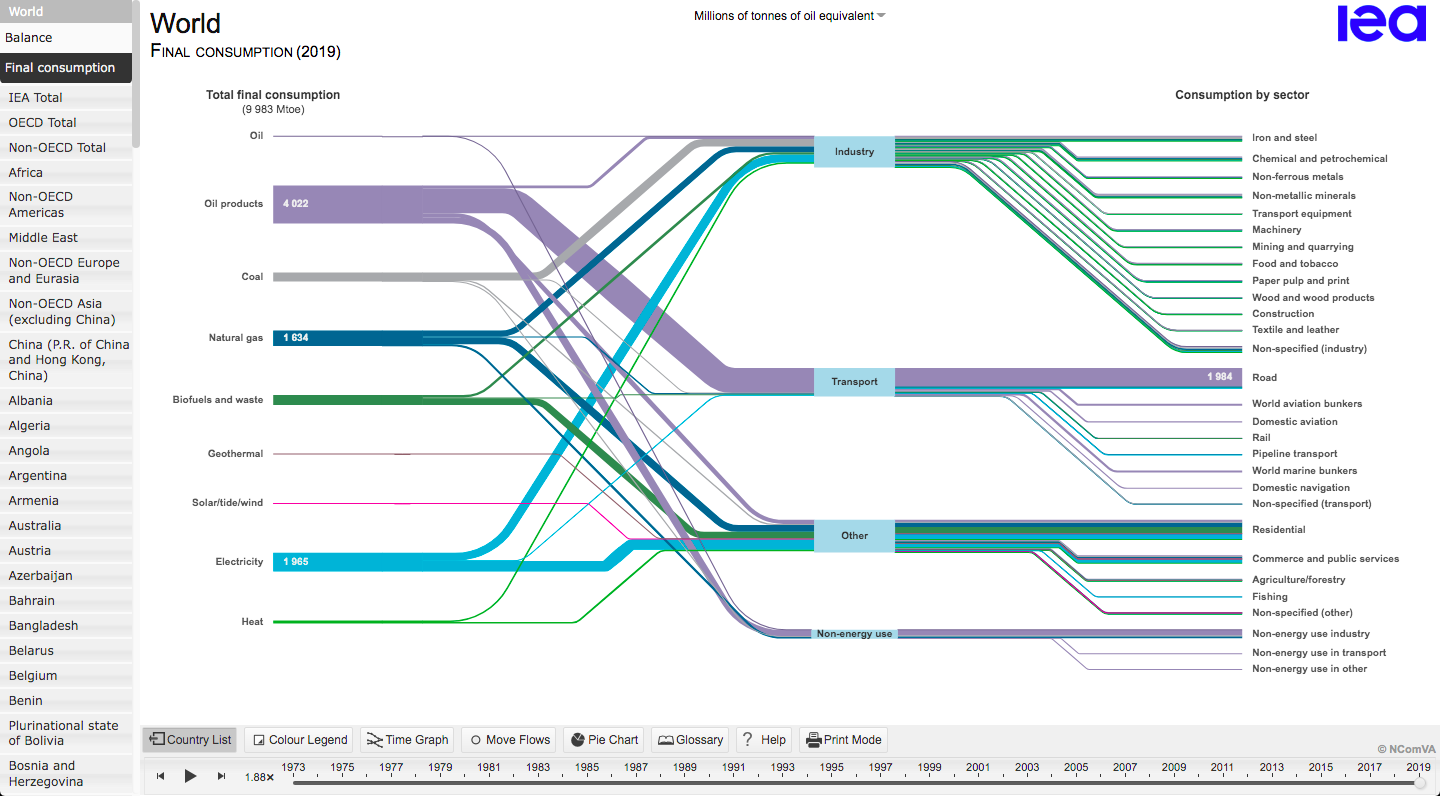
2_4 IEA
The International Energy Agency is a Paris-based autonomous intergovernmental organization,
established in the framework of the Organisation for Economic Co-operation and Development in 1974 in the wake of the 1973 oil crisis.
established in the framework of the Organisation for Economic Co-operation and Development in 1974 in the wake of the 1973 oil crisis.
2_4_0 IEA_STATISTICS_MAP
WORLD Balance [produnction/ consumption] by sector [TFC]_2015
799592 PJ_production
392871 PJ_consumption
406750 PJ_rejected endergy = 49%
799592 PJ_production
392871 PJ_consumption
406750 PJ_rejected endergy = 49%

WORLD total final consumption
by sector [TFC]_2015
392871 PJ
by sector [TFC]_2015
392871 PJ
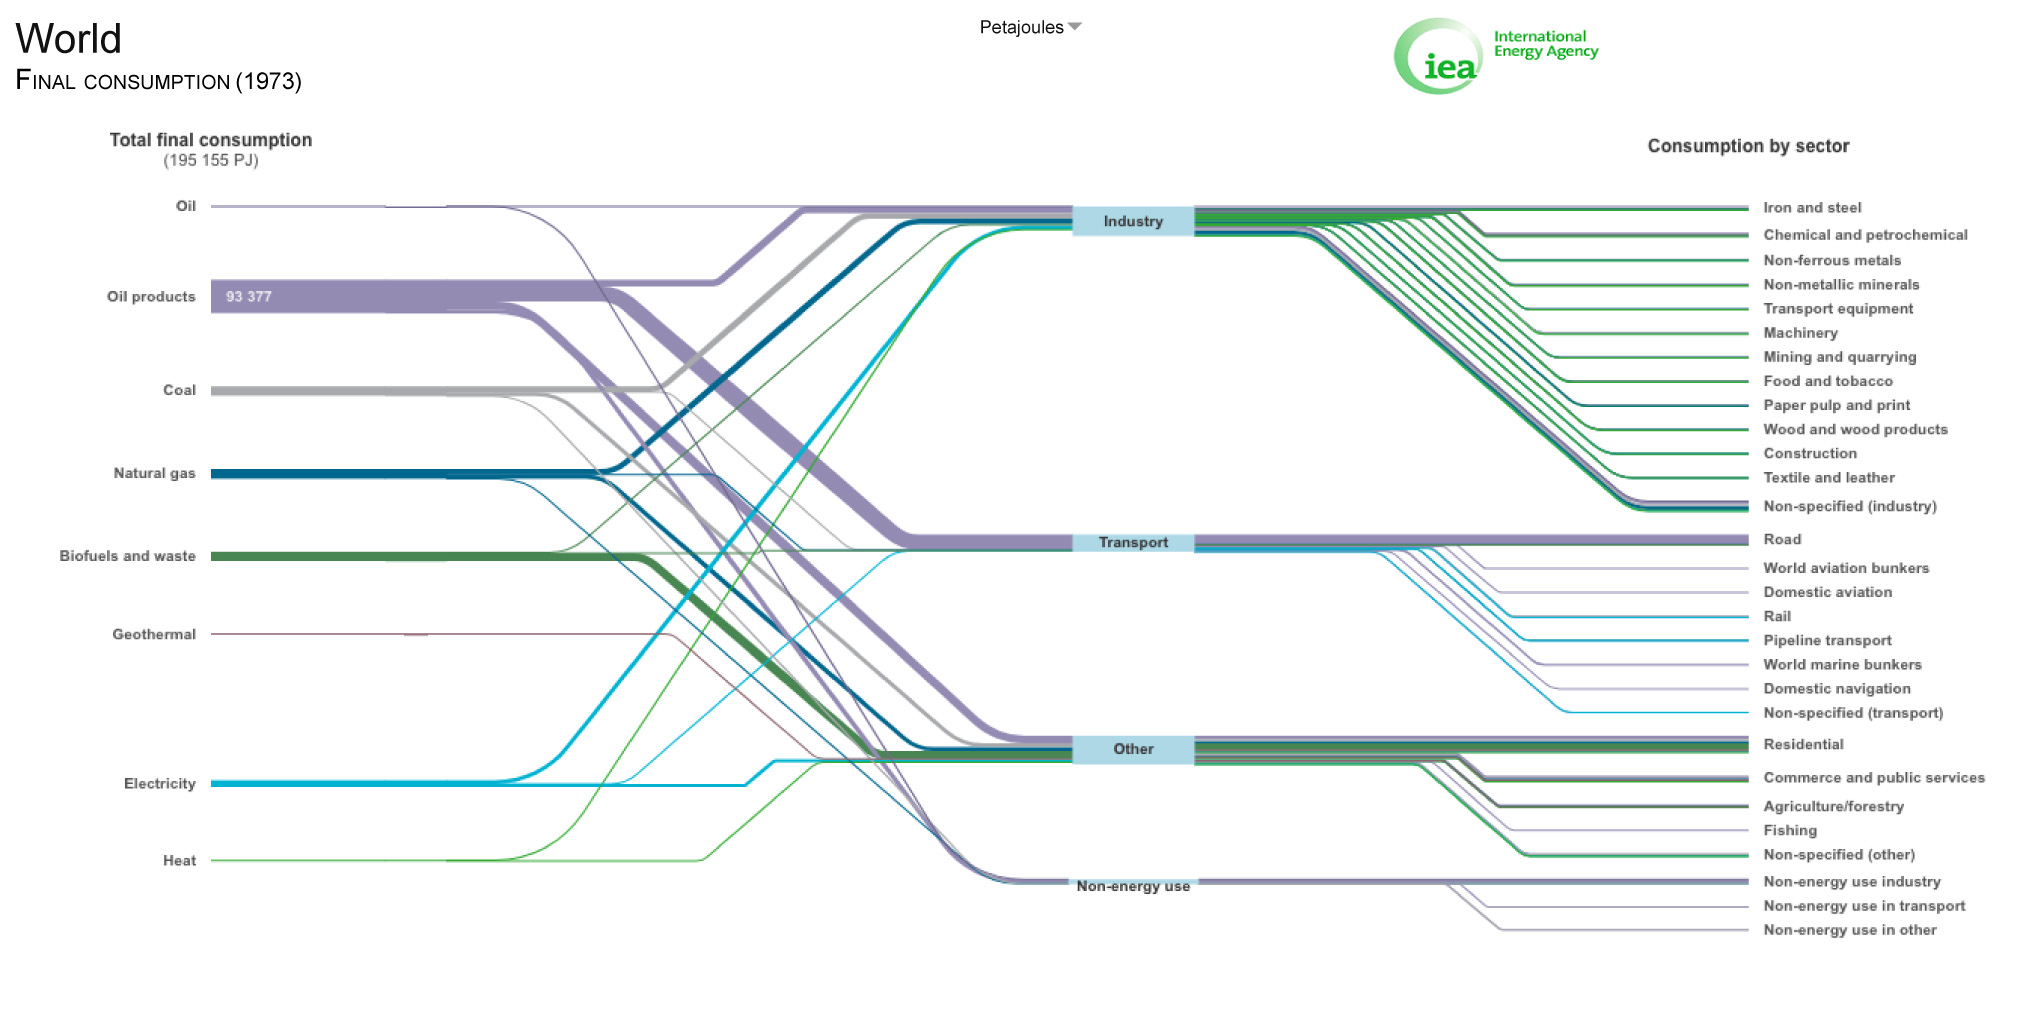
WORLD total final consumption
by sector [TFC]_1973
195155 PJ
by sector [TFC]_1973
195155 PJ
2_4_1 IEA_REPORT
2_4_1_1
IEA_Key world energy statistics_2017
2_4_1_2
IEA_World Energy Balances overview_2017
Fig. 27
OECD Total final consumption by sector [TFC] _2015
OECD Total final consumption by sector [TFC] _2015

Fig. 28
OECD Total final consumption by sector [TFC]_shares by energy source_2015
OECD Total final consumption by sector [TFC]_shares by energy source_2015

Fig. 5
Largest producers by fuel_2015
Largest producers by fuel_2015

2_5 IPPC
Intergovernmental Panel on Climate Change
The IPPC is a scientific and intergovernmental body [United Nations] it is , dedicated to the task of providing the world with an objective, scientific view of climate change and its political and economic impacts.
The IPPC is a scientific and intergovernmental body [United Nations] it is , dedicated to the task of providing the world with an objective, scientific view of climate change and its political and economic impacts.
2_5_0 IPPC_REPORT
IPCC AR4_Fourth Assessment Report 2007_full
2_5_1
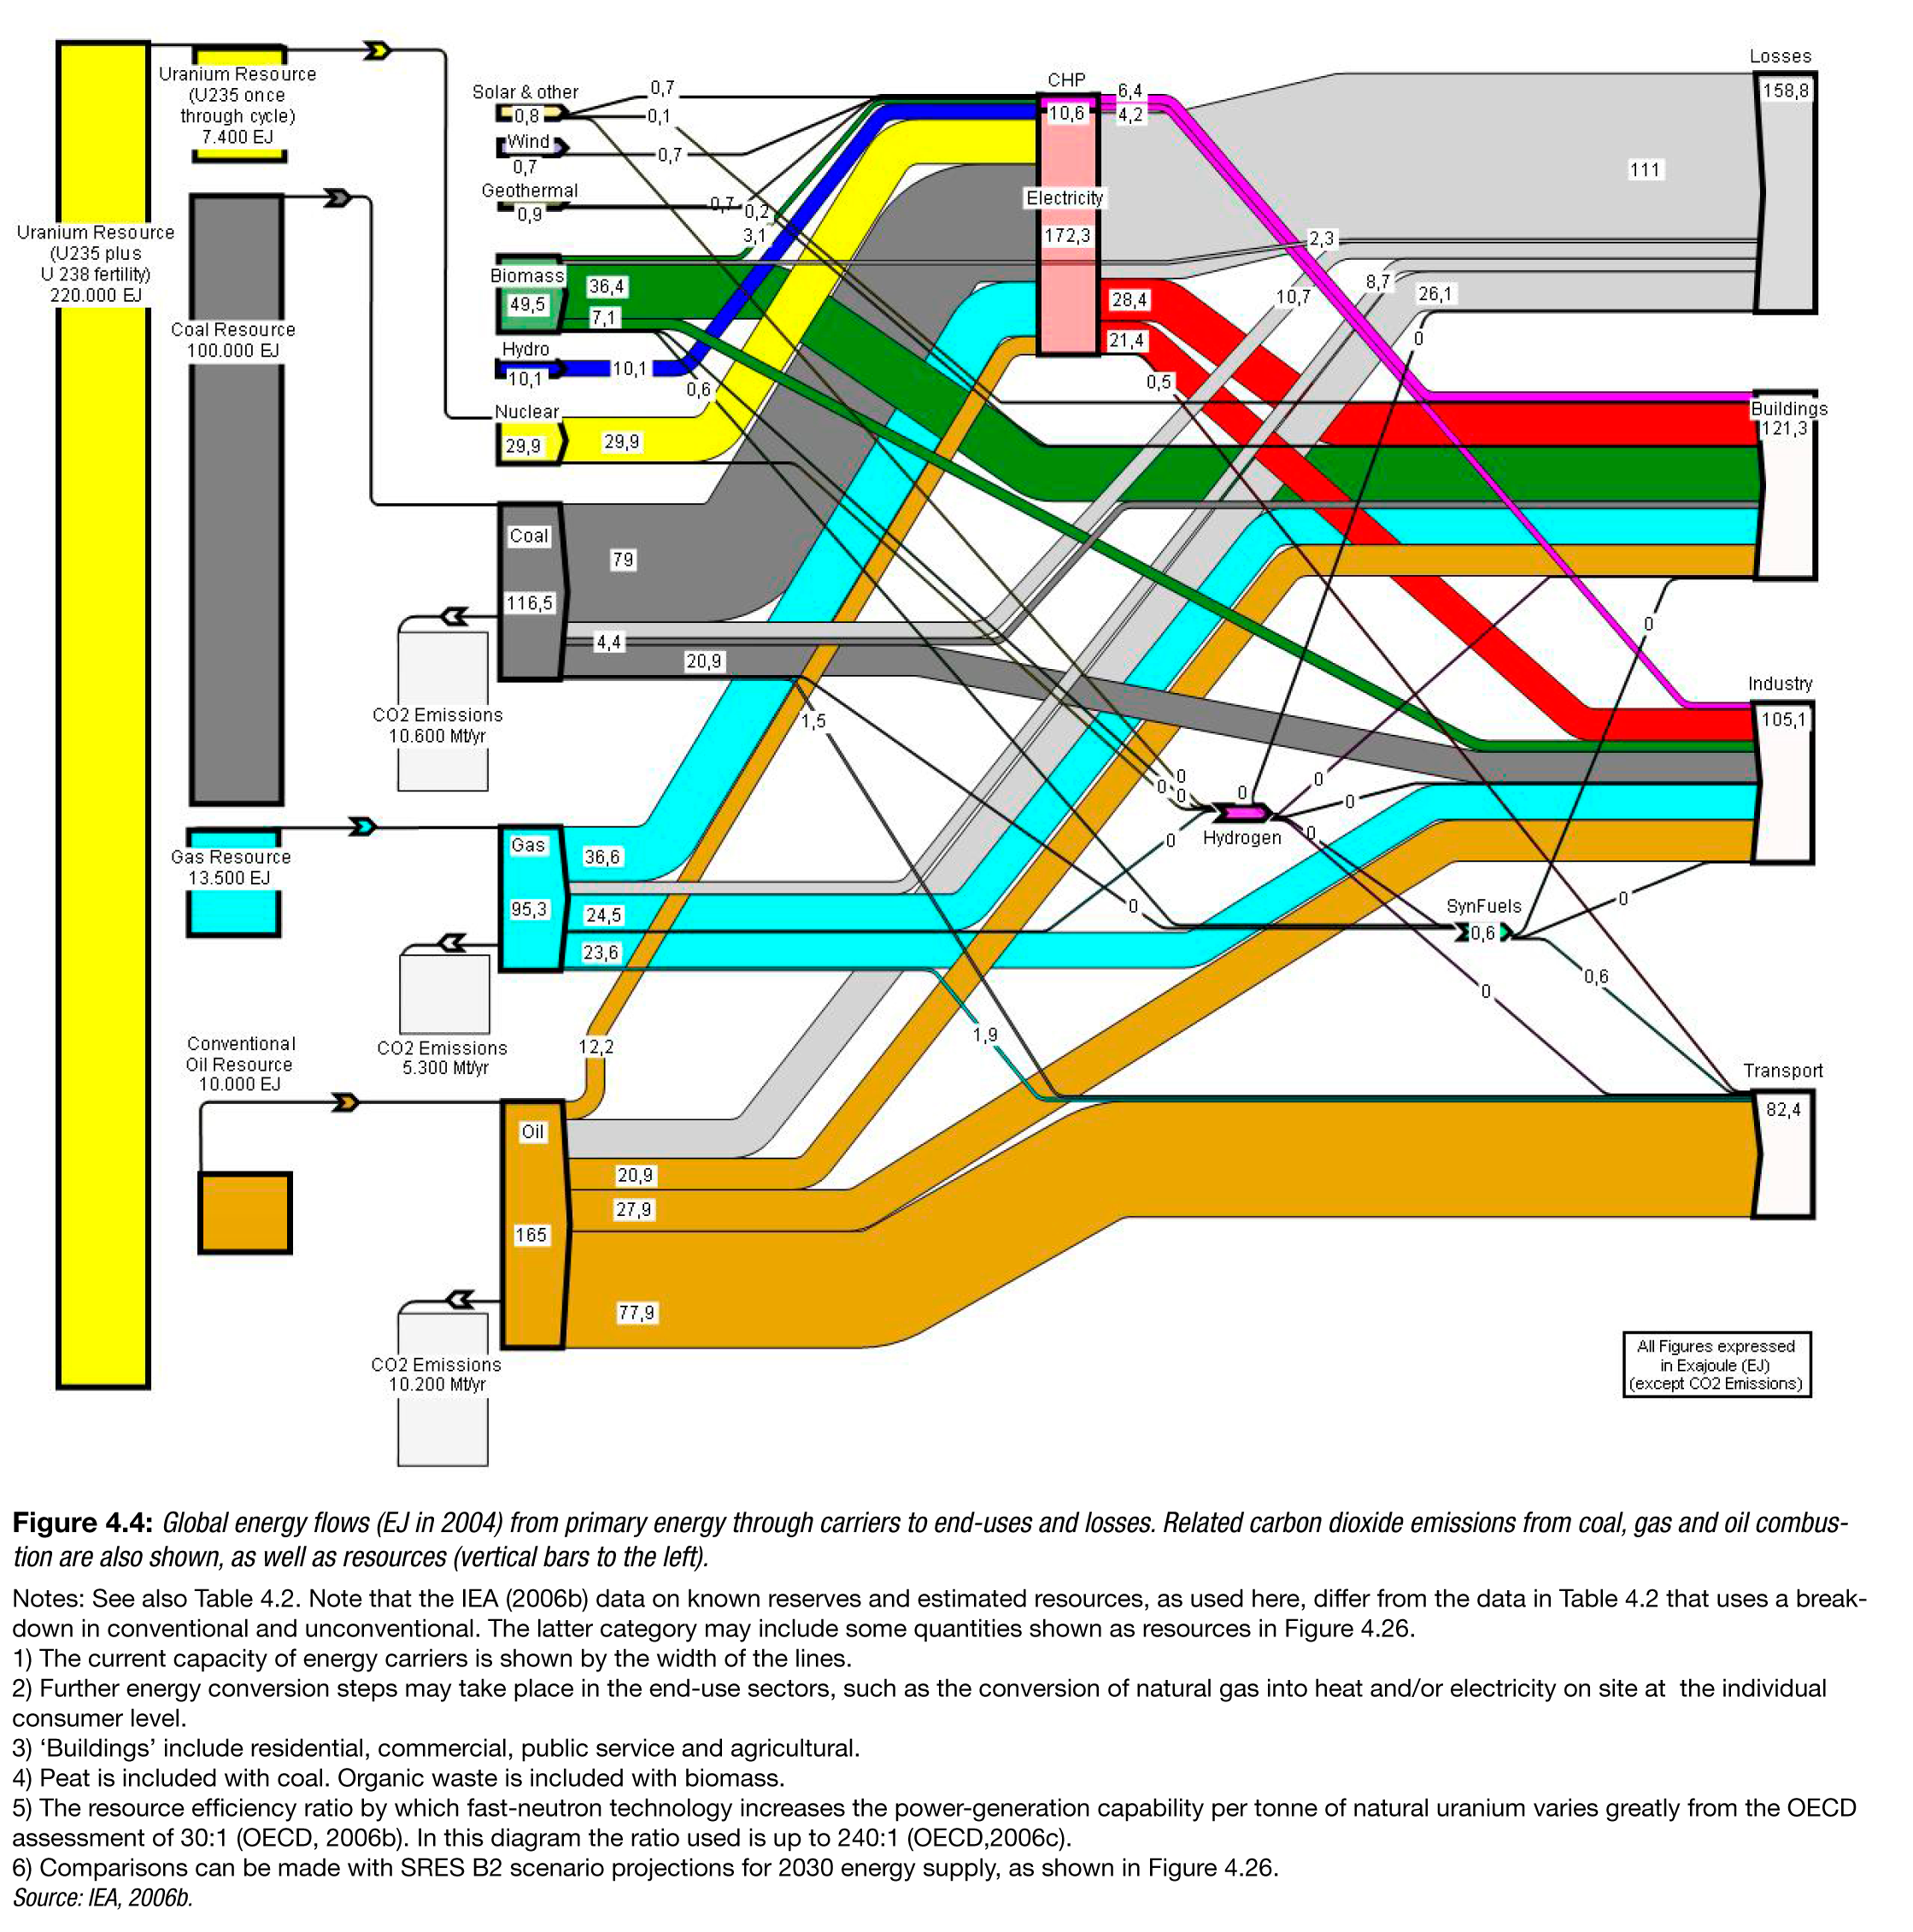
data source::
IPCC AR4 Fourt Assessment Report_climate change 2007: Mitigation of Climate Change
Ch 4_Global energy flows_2004
Fig. 4.4./page 259
IPCC AR4 Fourt Assessment Report_climate change 2007: Mitigation of Climate Change
Ch 4_Global energy flows_2004
Fig. 4.4./page 259
WORLD_Global energy flows+ Carbonemissions_2004_unit_EJ [1ExaJpoules= 1000 PJ]
468 700 PJ _energy IN
318 800 PJ _energy OUT
26 100 Mt / year _CO2 emissions
468 700 PJ _energy IN
318 800 PJ _energy OUT
26 100 Mt / year _CO2 emissions
2_6 EIA
The U.S. Energy Information Administration,
is a principal agency of the U.S. Federal Statistical System responsible for collecting, analyzing, and disseminating energy information.
is a principal agency of the U.S. Federal Statistical System responsible for collecting, analyzing, and disseminating energy information.
2_6_1 EIA_REPORT
International Energy Outlook_2017
Fig. 123
Transportation fuel consumption in OECD regions
quadrillion Btu
Transportation fuel consumption in OECD regions
quadrillion Btu

Fig. 125
Transportation fuel consumption in non-OECD regions
quadrillion Btu
Transportation fuel consumption in non-OECD regions
quadrillion Btu

1
INFO
1_1 CO2 -> O2 -> CO2 -> C cycle
photosynthesis:
6 CO2 + 6 H2O + energy
––> C6H12O6 + 6 O2
burn suggar - breath:
C6H12O6 + 6O2
––> 6 CO2 + 6H2O + energy
burn fossil fuel:
CH4 + 2O2 ––> CO2 + 2H2O +energy*
6 CO2 + 6 H2O + energy
––> C6H12O6 + 6 O2
burn suggar - breath:
C6H12O6 + 6O2
––> 6 CO2 + 6H2O + energy
burn fossil fuel:
CH4 + 2O2 ––> CO2 + 2H2O +energy*
1_2 Wait but Why_BLOG
Tim Urban
How Tesla Will Change The World
2015 06 02_
a story of energy++
How Tesla Will Change The World
2015 06 02_
a story of energy++
Energy production is more efficient in a power plant than it is in a car engine.
_Burning natural gas in a power plant is about 60% efficient
_In a car, burning gas is less than 25% efficient, [vast majority of the energy lost to heat]
_Burning natural gas in a power plant is about 60% efficient
_In a car, burning gas is less than 25% efficient, [vast majority of the energy lost to heat]


Lawrence Livermore National Laboratory
Energy Flow Chart
[PJ_ petajoules. 1 petajoule = 1 quadrillion joules ]
World_2011
Energy Flow Chart
[PJ_ petajoules. 1 petajoule = 1 quadrillion joules ]
World_2011

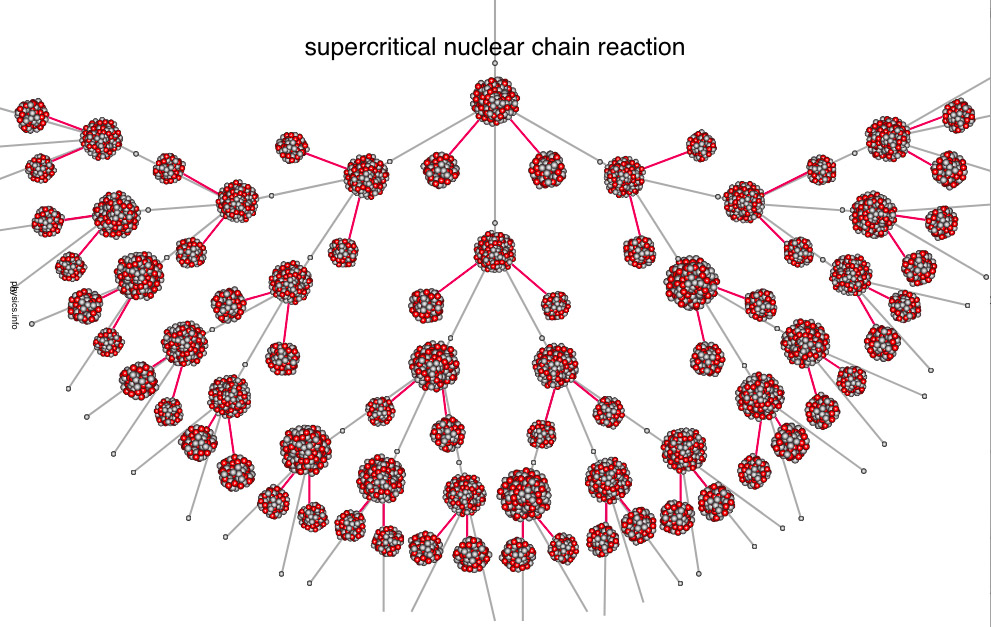
1_3 FISSION
Nuclear fission
U 235/92 [Uranium] + 10n [neutron]
→ fission fragments + 2.4 neutrons
+ 192.9 MeV
Pu 239/94 [Plutonium] + 10n [neutron]
→ fission fragments + 2.9 neutrons
+ 198.5 MeV
U 235/92 [Uranium] + 10n [neutron]
→ fission fragments + 2.4 neutrons
+ 192.9 MeV
Pu 239/94 [Plutonium] + 10n [neutron]
→ fission fragments + 2.9 neutrons
+ 198.5 MeV

1_3_1
Nuclear fission
When the nucleus of an atom splits into lighter nuclei through a nuclear reaction the process is termed as nuclear fission.
This decay can be natural (spontaneous splitting by radioactive decay), or can actually be simulated in a lab by achieving necessary conditions (bombarding with neutrinos).
The resulting fragments tend to have a combined mass which is less than the original.
The missing mass is what is converted into nuclear energy in the above reaction.
An example of nuclear fission is the splitting of Uranium-235. The equation of the reaction has been given below.
U [235/92] + n [1/0]
→ Ba [144/56] + Kr [89/36] + 3 n[1/0]
+ 210 MeV
1_4_1 FUSION
proton - proton chain
happens in the Sun.
Light nuclei join to form a heavier nucleus. Energy is released in the process.
90% of the universe consists of H and He
[almoust 100% created in the first minutes after the big bang- 75% H, 25% He,+ trace amount of Li--> 200 billion years - stars form
Stars begin as a cloud of mostly H hydrogen with about 25% He helium and heavier elements in smaller quantities.
Fusion of light elements [till Fe or Ni]
--> releases energy
(exothermic process)
Fusion of heavier Elements
--> energy retained by nucleons (endothermic process)
a supernova can produce enough energy to fuse nuclei into elements heavier than Fe iron.
where fusing iron atoms together requires more energy than is release.
overall_proton-proton chain:
γ_gammarays, ν [Nu]_neutrino, e_elektron
4 H [1/1]
→ He [4/2]
+ 2 (e [0/+1] + γ [0/0] + ν [0/0]) (26.7 MeV)
___________________________
stage 1_neutron is created
2x
H [1/1] + H[1/1]
→ H [2/1] + e [0/+1] (0.4 MeV) + ν [0/0](1.0 MeV)
stage 2_one neutron still there
2x
H [1/1] + H [2/1]
→ He [3/2] + γ [0/0] (5.5 MeV)
stage 3_one more neutron
1x
He [3/2] + He [3/2]
→ He [4/2] + 2 H [1/1] (12.9 MeV)

1_4_2 NUCLEOSYNTHESIS
Nuclear fusion_heavy
elements
Eventually as a star gets older you start seeing fusion of heavier elements,
He_helium, C_carbon, N_nitrogen, etc up until you hit Fe [56/26] _iron
at which point you hit what is known as the iron peak where fusing iron atoms together requires more energy than is release.
Heavier elements are all formed during supernovas and thus we see lower level of abundance. [link]
Stars heavier than the sun use C [1/2 ]as a catalyst.
20 to 120 times the mass of the sun. Really, really heavy stars do something different

1_4_3 NUCLEOSYNTHESIS
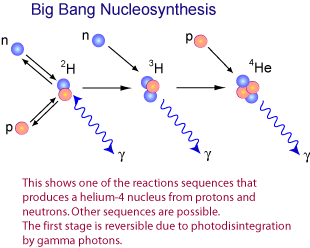
Big Bang Nucleosynthesis
By the first millisecond, the universe had cooled to a few trillion kelvins (1012 K) and --> quarks finally had the opportunity to bind together into free--> protons and neutrons.
Before one neutron half-life passed (614.8 sec) nearly every --> neutron had paired up with a proton, and nearly every one of these pairs had paired up to form helium.
By the time the universe was three minutes old the process had basically stopped and the relative abundances of the elements was fixed at ratios that didn't change for very long time: 75% H hydrogen, 25% He helium, with trace amounts of deuterium (hydrogen-2), helium-3, and lithium-7.
Explaining The Big Bang . science+ / D news] . 2016 04 21
Images of the Infant Universe . SVA - Silicon Valley Astronomy Lectures
. Lloyd Knox . 2014 12 08
April 5th, 2023